Excel Example
Scatter Plot
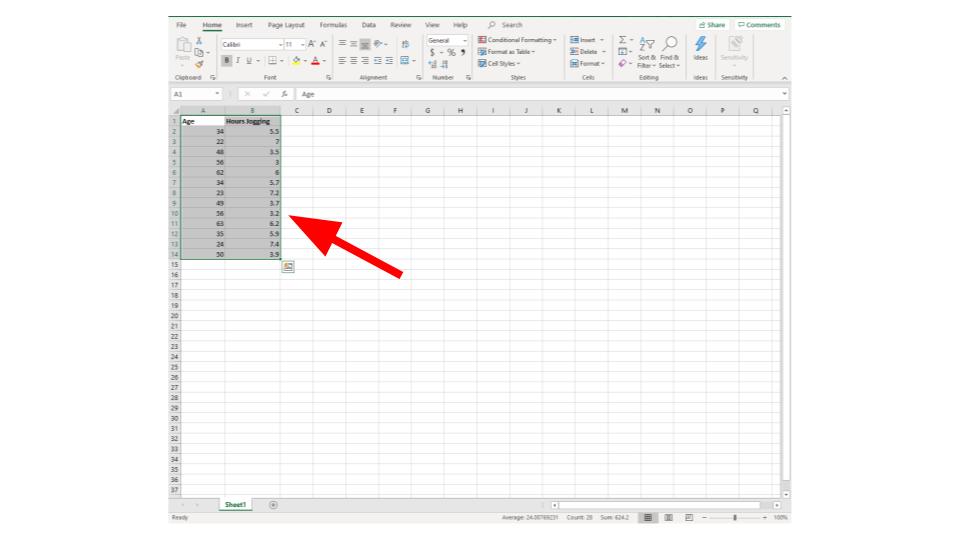
Step 1: Highlight your data

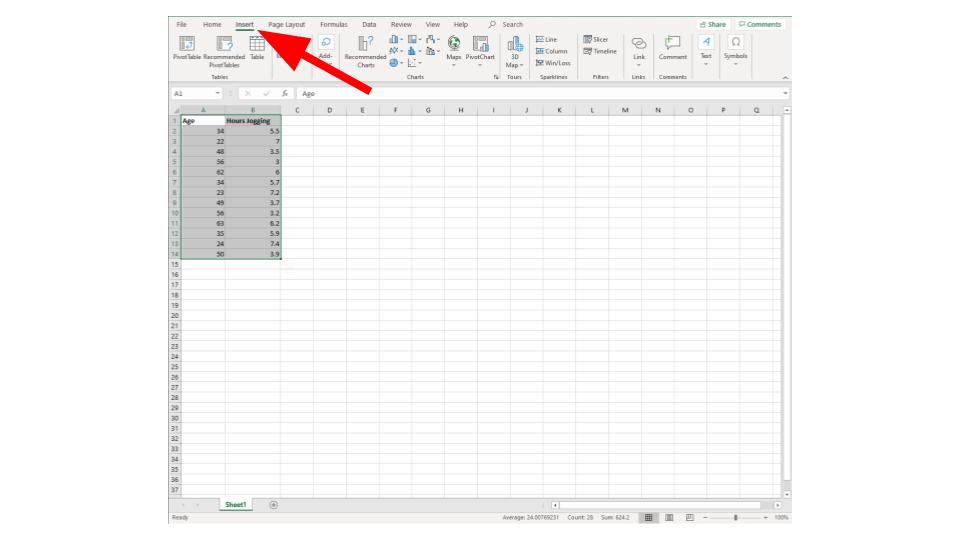
Step 2: Select "insert" from the top menu

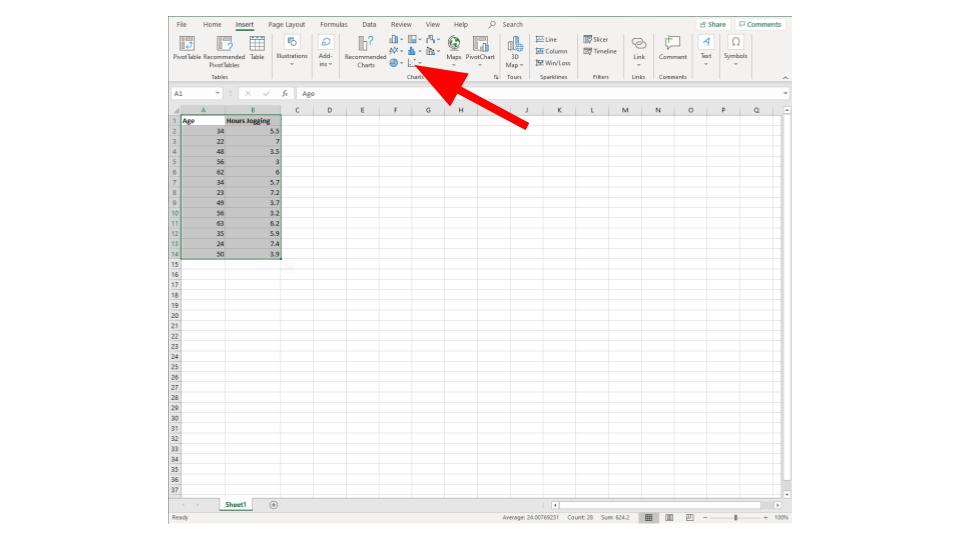
Step 3: Select the "scatter" option from the top menu (looks like a bunch of dots)

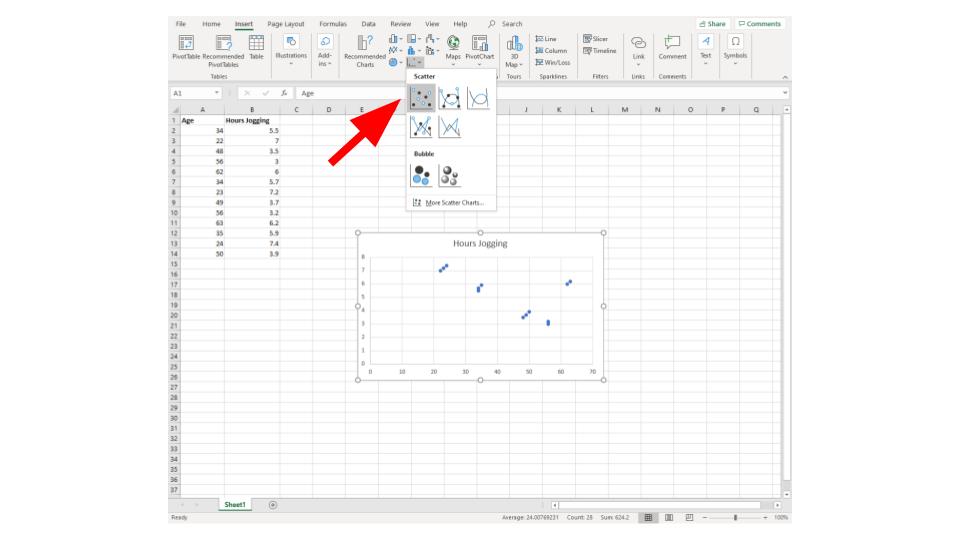
Step 4: choose the scatter plot from the drop down menu

If you want to see this done watch the following video: